For CPG brands especially, keeping your customers engaged and coming back for more can make the difference between a healthy LTV or a shrinking one. As we reported previously, returning customer revenue is increasingly responsible for keeping brands afloat.
But how do you know if your retention strategy is working? What questions should you ask yourself and what data do you need to answer them?
Here are five insights CPG brands can use:
1. Typical time between orders at a store level
At Repeat, we call the overall time between orders your store's "replenishment interval." It's a key metric to inform your retention strategy.
- When you reduce your replenishment interval, customers increase their LTV at a faster rate, and the value of the customers you worked hard to acquire increases.
- Your store-level replenishment interval is one of the most important indicators of your retention strategy’s effectiveness.
The most effective way to look at store level replenishment intervals is by calculating the time between orders, then identifying the median, lower, and upper quartiles.
With Repeat, we’ll calculate present replenishment intervals in your dashboard like this:
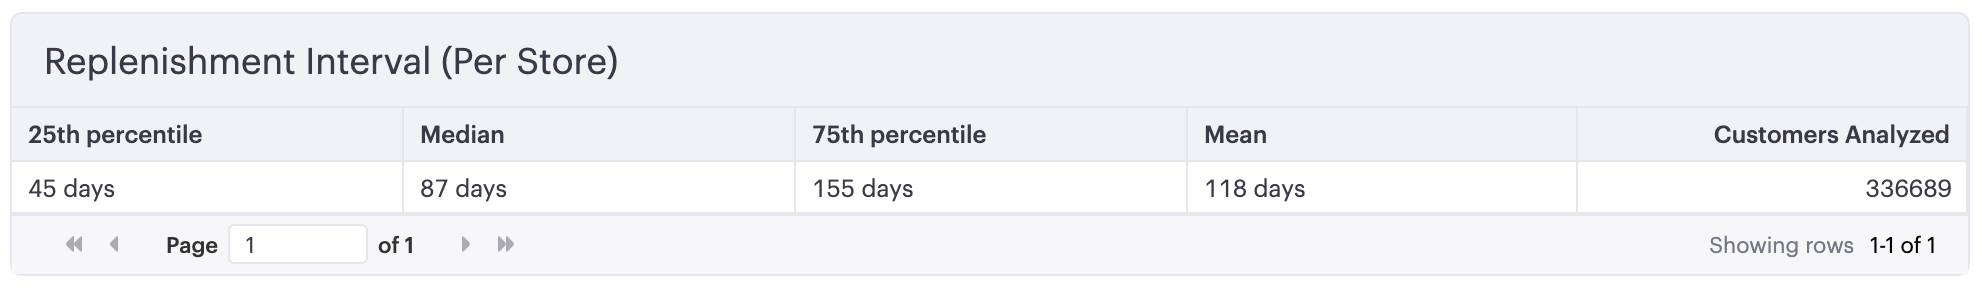
In this example, our median replenishment interval tells us most reorders are likely to happen around 87 days from the previous order.
We can also see this at a customer level. The chart below shows the number of customers whose average replenishment window falls within a 10-day bucket of time:
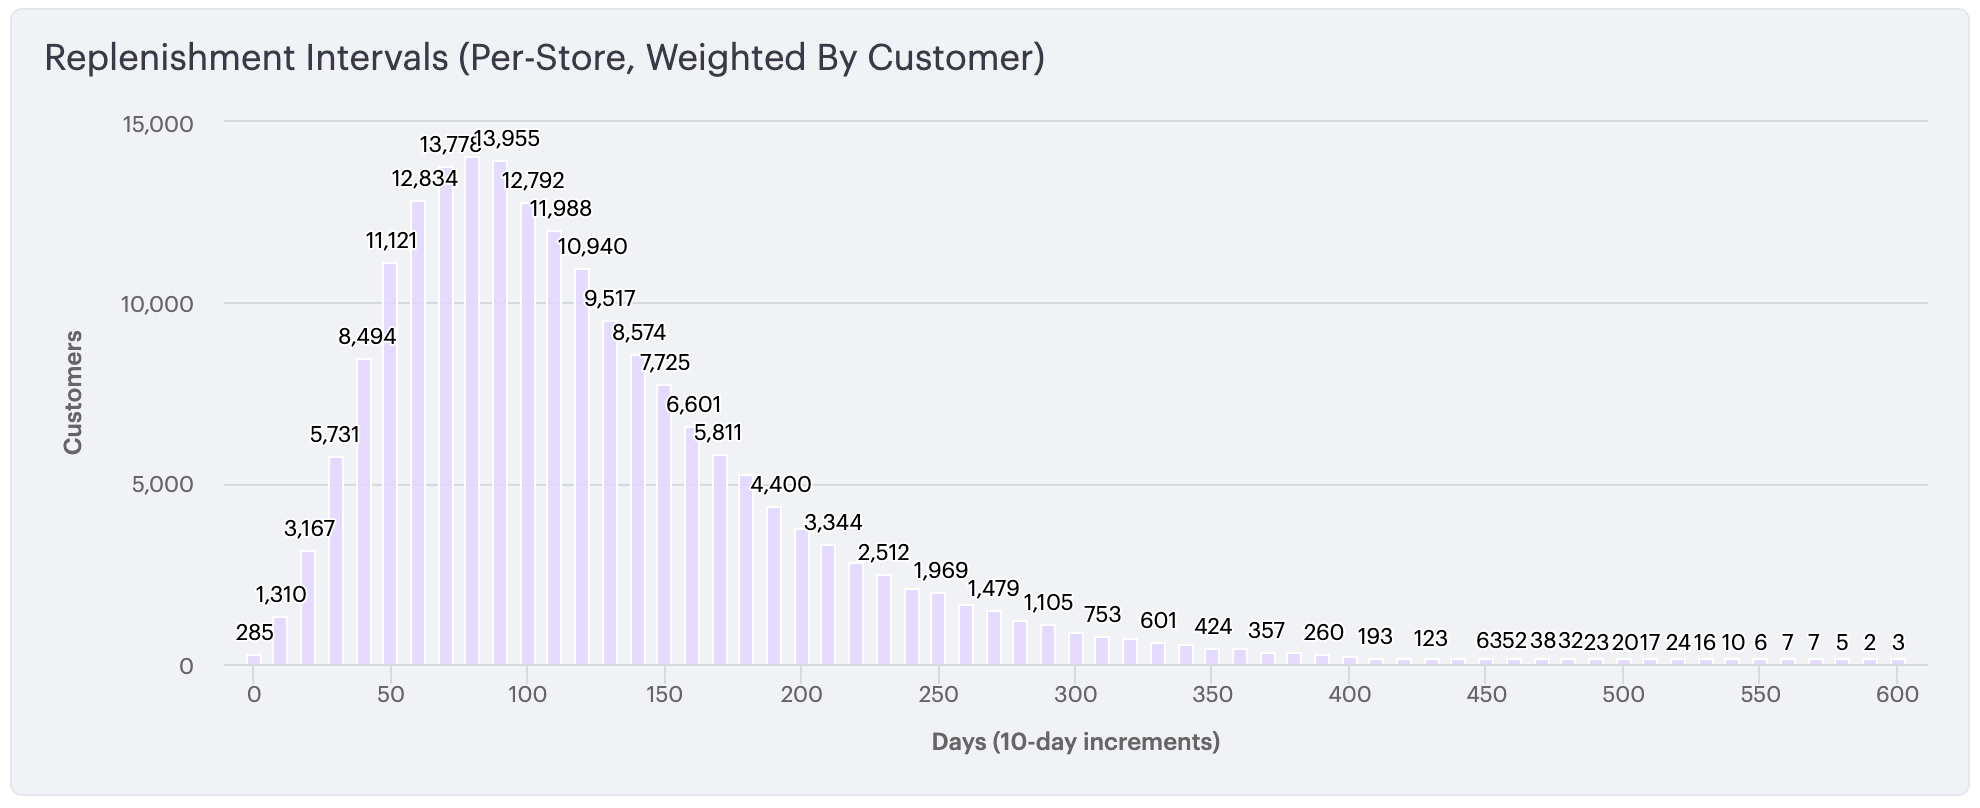
This visual representation shows that the bulk of this store’s customers have a replenishment interval between around 50 and 150 days.
For a brand with a simple product catalog, where most products are consumed at about the same rate, this information alone is enough to make some intelligent changes to your retention strategy.
Time reorder flows with store-level replenishment intervals
The median store-level replenishment interval would give us a good idea of how long to wait after a customer places an order before starting a reorder flow in email or SMS. Want to shorten that time? Try starting your flow a little earlier so the messages are delivered just before a customer is likely to place their next order.
Time winback flows with store-level replenishment intervals
Similarly, the 75th percentile of replenishment intervals is a great time to consider triggering a winback flow. Consider a more more aggressive discounting strategy in this flow to push customers to shorter replenishment intervals.
What about stores that have a more varied product catalog, where products might be consumed at different rates? There’s another question we can ask to dive deeper.
2. Typical time between orders at a product level
Reviewing your replenishment intervals per product or per variant gives you another layer of intelligence to inform your strategy. Here’s how this looks in Repeat:
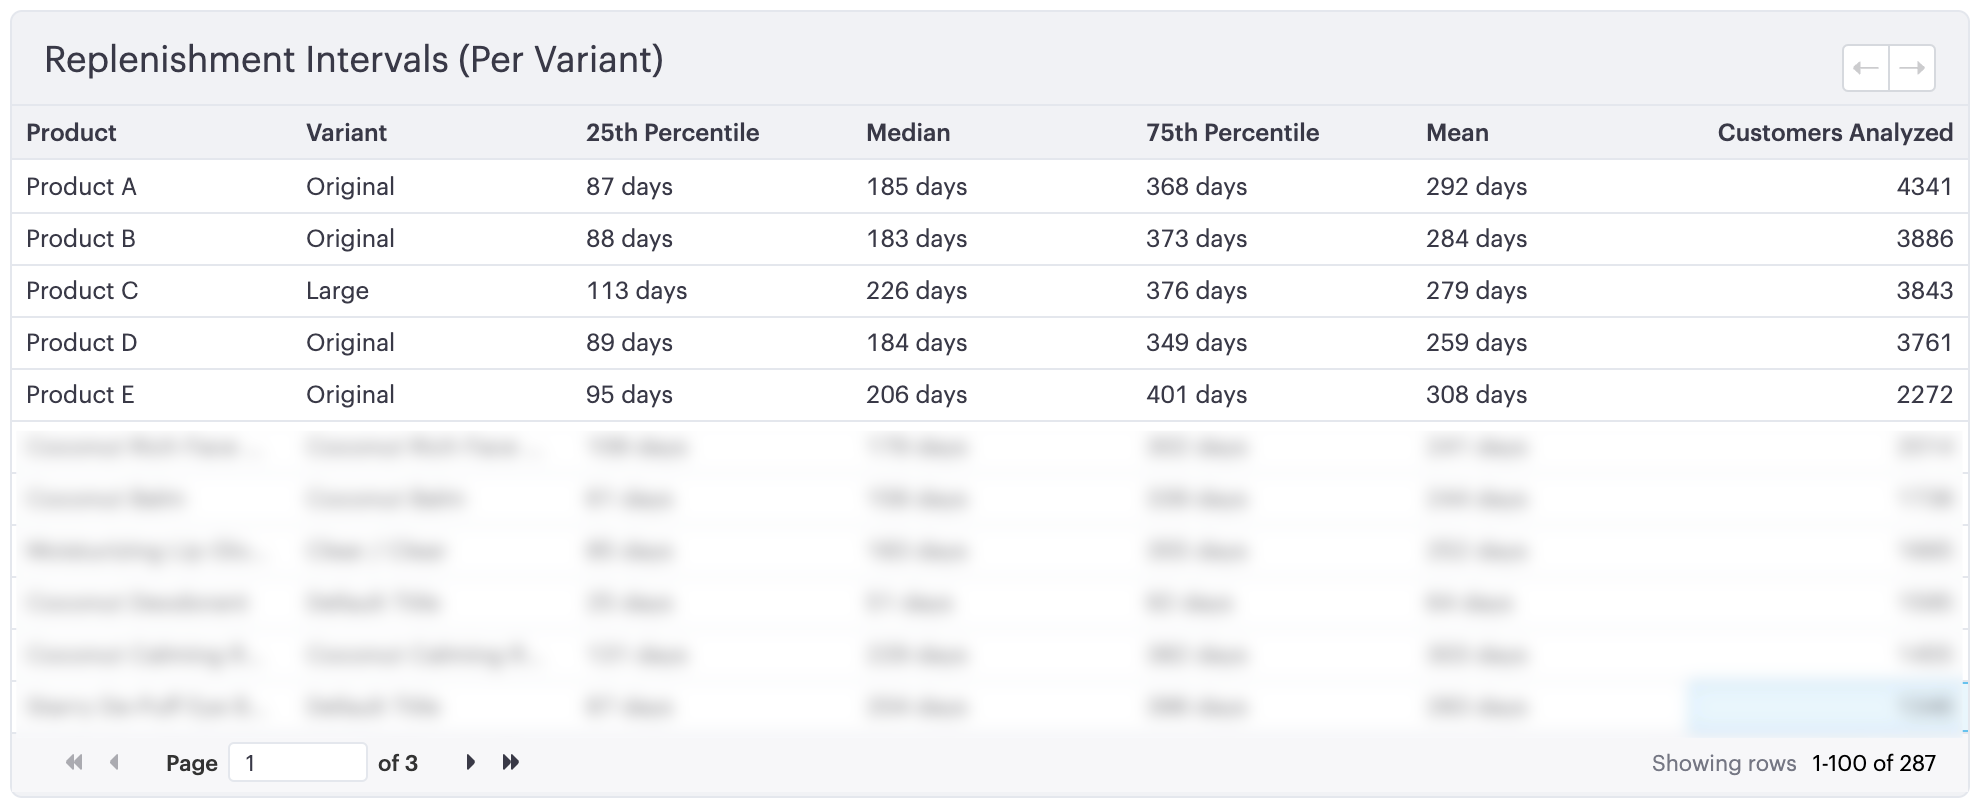
The five products above have a good amount of variance, ranging from 183 days at the median, up to 206. So, what do you do with this knowledge?
There’s plenty you can do with this data:
- Time your replenishment & winback flows so that emails or text messages arrive at the optimal time based on what product the customer ordered. (A quick side note here: if you’ve built a replenishment flow like this, you know the convoluted branching logic that’s required to pull it off, especially with a large catalog. You’re welcome to walk that path alone, but Repeat has solved this by automating the timing of replenishment flows.)
- Consider using this data to offer subscription renewal options that match actual consumption rates (instead of guessing based on what you think people are likely to use).
- Experiment with package sizes to balance your replenishment intervals with product cost. Perhaps your data will reveal that a package size with slightly less volume of product is consumed at a faster rate.
Let’s look at another product-focused question that can help decrease your replenishment intervals.
3. First product ordered vs replenishment intervals
Your acquisition and your retention strategies are intrinsically intertwined. One of those links between the two worlds is the relationship between the items that customers buy on their first order and the time it takes them to place a second order.
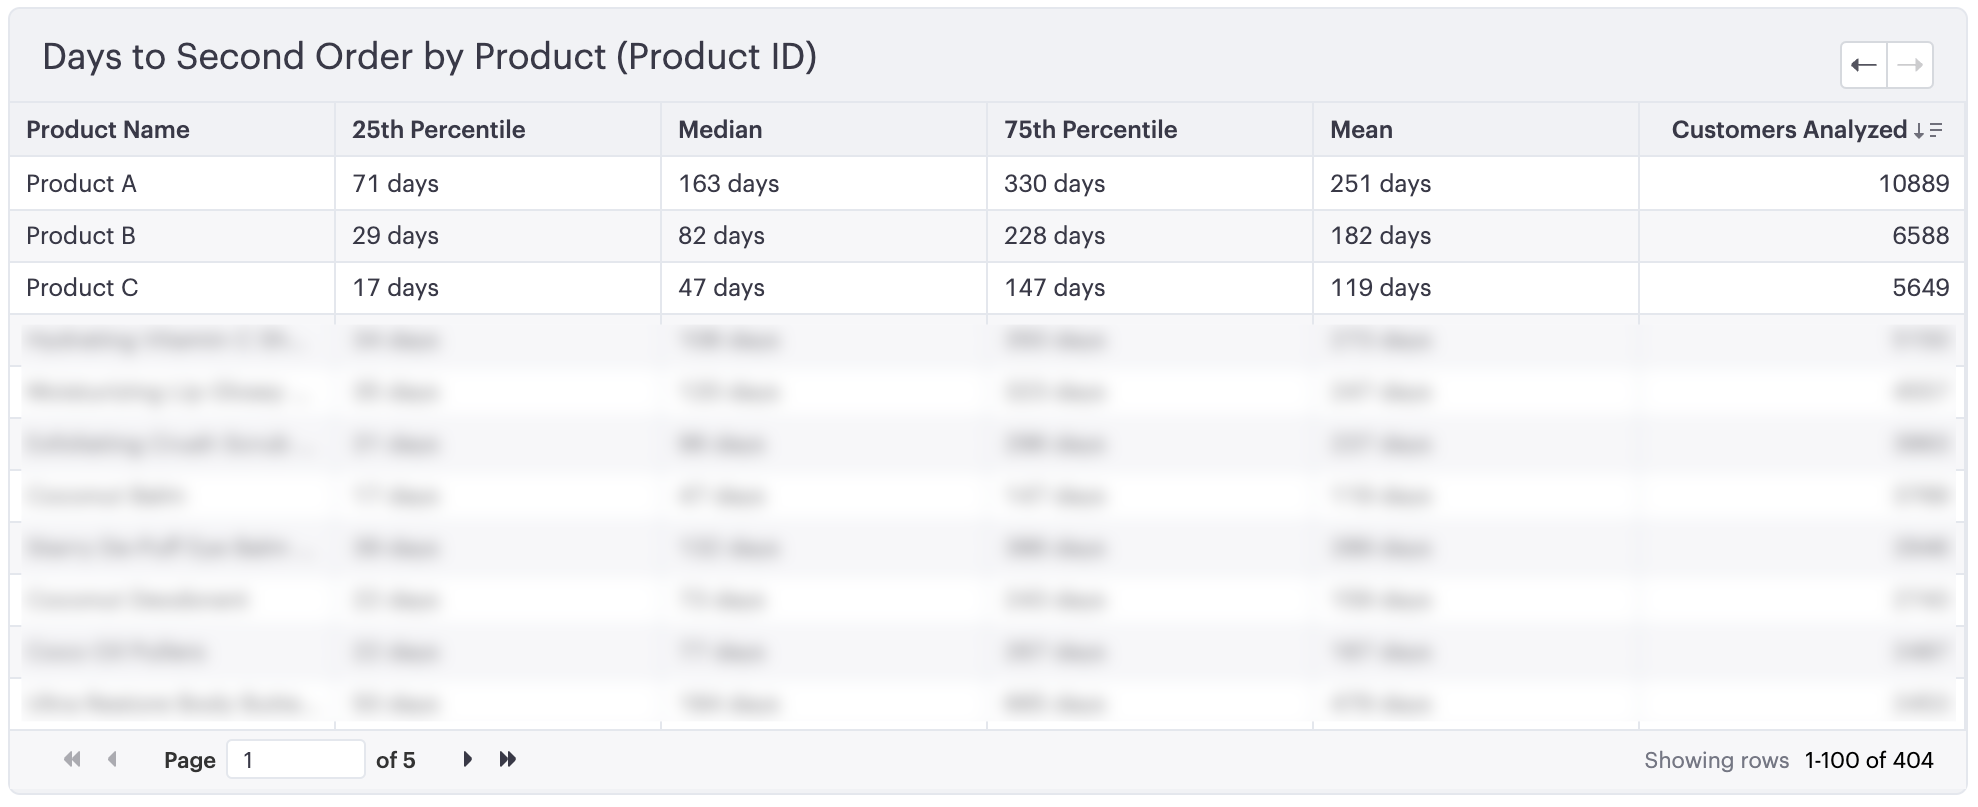
By calculating the replenishment intervals between first and second orders by product, you can begin to uncover this relationship. Repeat’s dashboard provides a table that does just that:
Use first-to-second order replenishment intervals for merchandising
This replenishment interval helps inform your merchandising strategy for acquisition. Consider the table above. These products have first-order replenishment intervals that range from a median of 47 days all the way up to 163 days.
Assuming these products have a similar price and conversion rate for new customers, the product you should prioritize in acquisition is clear. Use this insight and choose products that have a shorter time to second order when you are:
- crafting landing pages for prospects
- choosing products for your pre-purchase email flow
- considering which products to feature on your home page
Next, let’s compare replenishment intervals between new and returning customers.
Replenishment intervals by order count
By understanding how replenishment intervals change as customers place more orders, we can hone our retention strategy further. Take a look at this example from another Repeat brand:
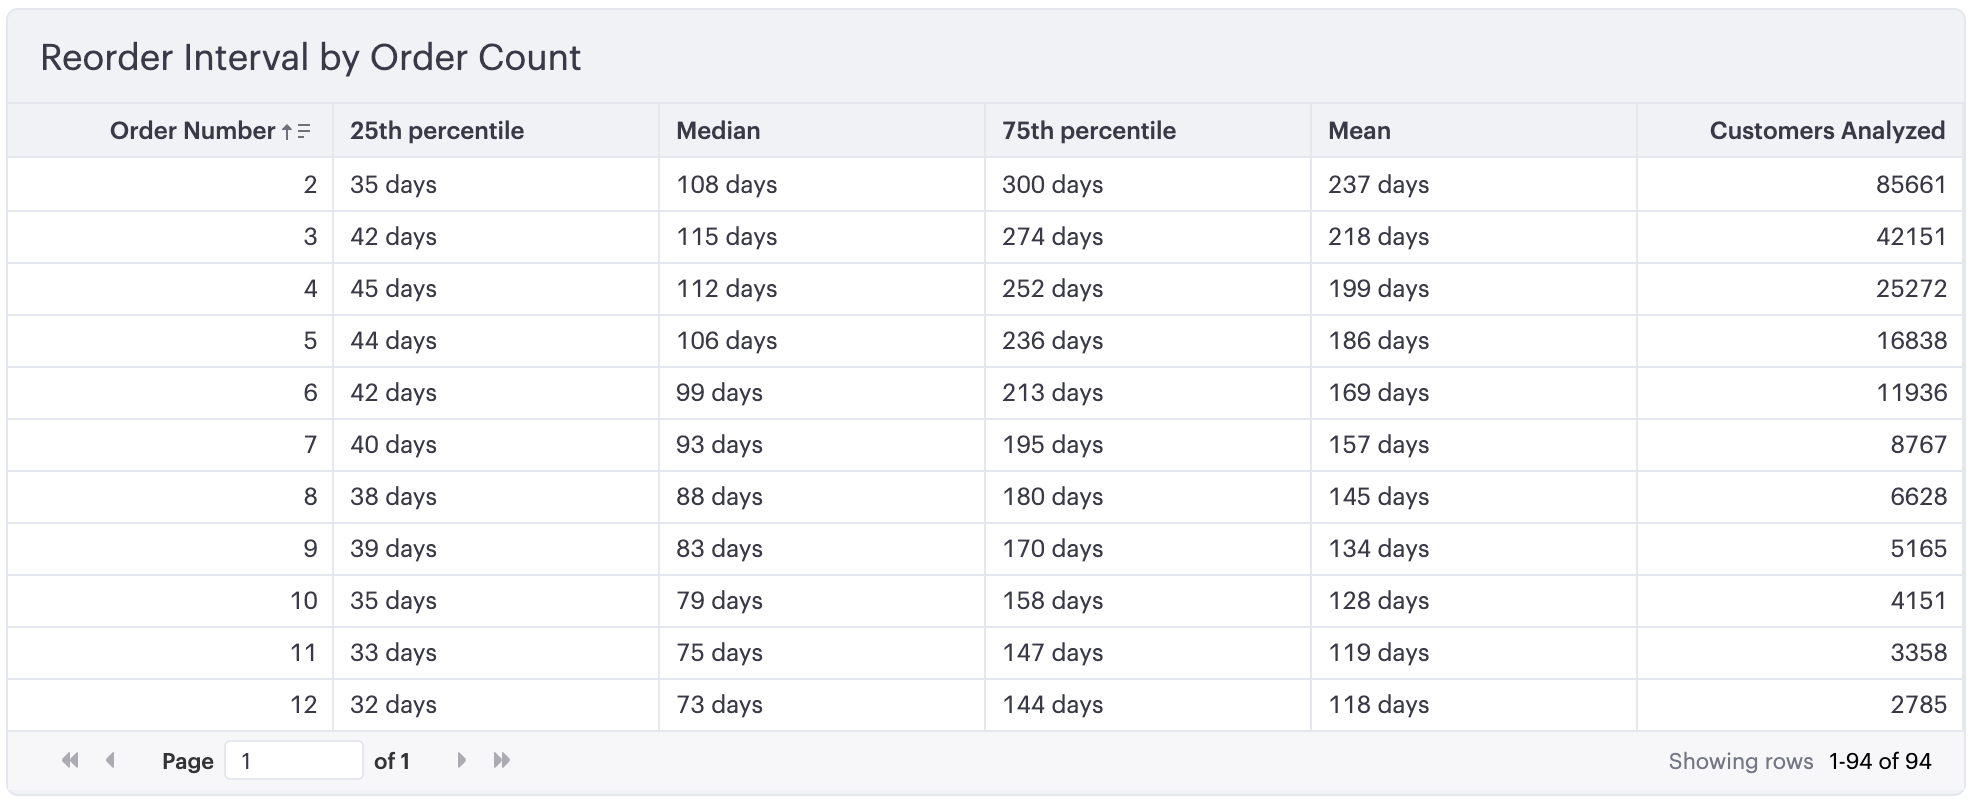
From the second order to the twelfth order, the median interval has gone from 108 days down to 73 days.
It feels intuitive when you see it: customers habituate using your product over time, so their consumption rate increases as they place more orders. This pattern is typical across the brands we work with.
What do you do with this information?
- Tailor the timing of your reorder flows to the number of orders that a customer has placed. Give newer customers a little longer before you remind them to repurchase, and decrease the time as customers place higher numbers of orders.
- Use this insight to know when to push a one-time-purchase customer into a subscription. Consider holding off on offering a subscription until the replenishment interval drops to a point where a customer would find a subscription genuinely helpful.
Next, let’s slice this same data in another way.
5. Reorder probability vs order number
The probability that a customer will place another order is one of the most effective ways to measure customer loyalty. Intuitively again, you probably know this:
Customer loyalty increases as customers place more orders.
So how can you calculate customer loyalty by number of orders? Here’s a simple formula:
Next Order Probability = (count of customers who have placed n+1 orders) / (count of customers who have placed n orders)
Using the table above (where “Customers Analyzed” is the number of customers who have placed n orders), we can visualize the change in loyalty by order number like this:
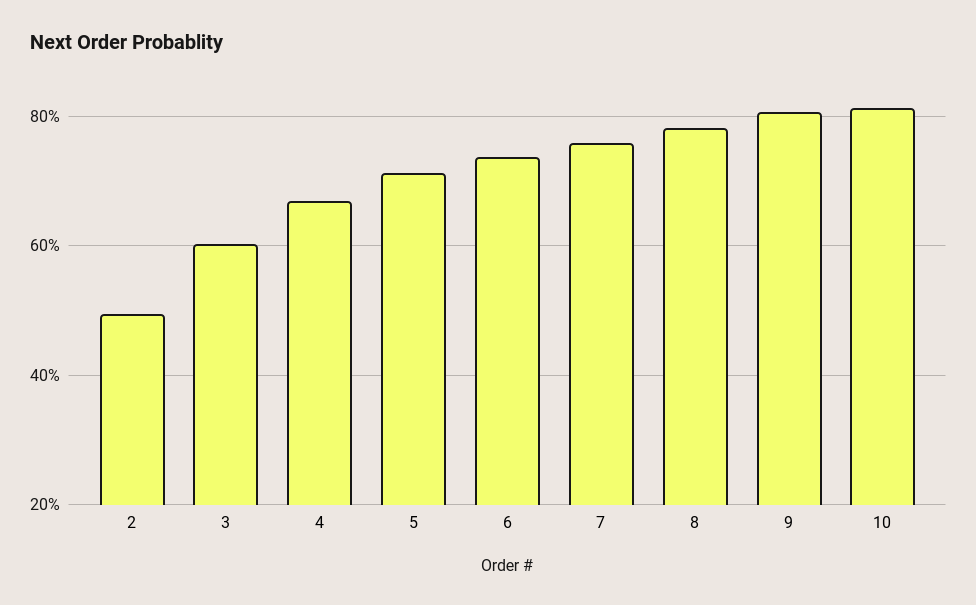
A customer who has placed two orders has a 49% probability of placing a third order. The probability continues to increase in substantial steps until a customer has placed 5 orders and has a 71% probability of placing another order.
Bigger offers for newer customers
This is valuable information when you’re thinking about how to structure discounting and offers within your retention strategy. You can impact this probability. Craft bigger, better offers that sway newer customers to reorder. If this brand can get a customer over the hump from order two to order three, that customer’s reorder probability has increased from 49% up to 60%.
Reduced offers for loyal customers
Conversely, it makes sense to dial back your offers and discounts as customers become more loyal. For loyal customers, you’ll maximize revenue and AOV with a flow that doesn’t offer a discount for the first few messages. There’s a high probability that they’ll order without crazy offers. Instead, wait until they haven’t bitten on a gentle nudge and start to stack on offers later in the flow.
What’s next for improving your retention strategy?
To improve retention, CPG brands need a better understanding of their customers using data. Ultimately, the key to effective retention lies in personalization. Data can help streamline your approach, allowing you to identify customer needs and find a strategy that works for you.
While there will certainly be some similarities across brands, focusing on your own data will enable you to meet your customer where they are, no matter where they fall in their lifecycle.
The feedback loop to maximize retention
Building an effective feedback loop from your data and insights to your automation and personalization efforts is central to maximizing your customer lifetime value and the success of your retention efforts.
It’s no consequence that this feedback loop is at the core of what Repeat does:
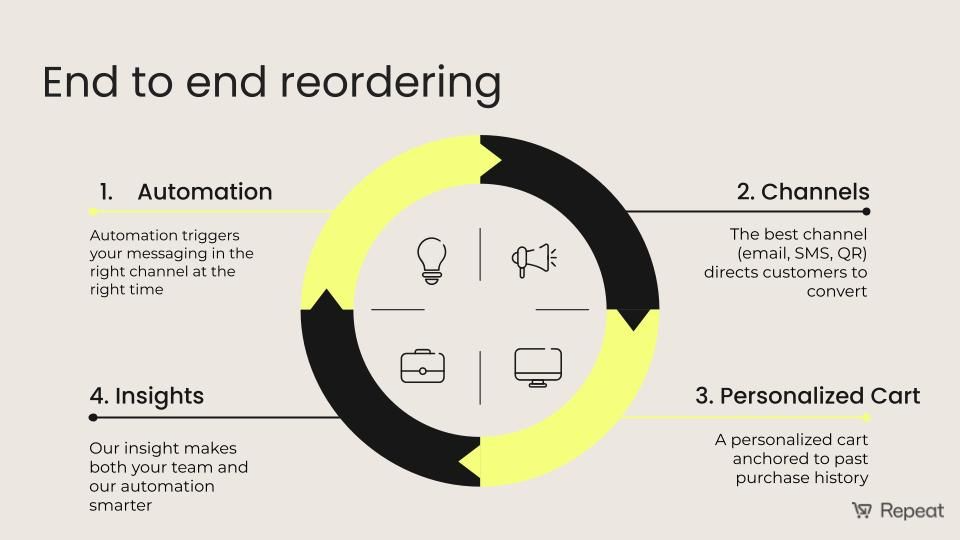
Repeat can help you create more valuable and loyal customers.